
The Shortage of Estimators
US construction puts $2.2 trillion of work in place a year. The profession that prices it is 221,400 people, shrinking, and aging out faster than replacements arrive. Our analysis of federal data shows how deep the shortage runs and why the no-bid became the industry’s largest unrecorded loss. It also shows where the answer is taking shape: AI on the estimating desk.
Compiled from US Census Bureau, US Bureau of Labor Statistics, Associated Builders and Contractors, NCCER, Deloitte, McKinsey, and JBKnowledge data, with original survey research from The State of Industrial Estimation 2026 (n=312).
The email every estimator knows by heart
On a Thursday afternoon at a mechanical contractor on the Gulf Coast, an invitation to bid arrives for a process unit expansion. The drawing set runs to 340 sheets. The chief estimator opens the P&IDs, checks the bid calendar, and counts the desks: two estimators already buried in a turnaround bid, a trainee who started three months ago, and himself. The bid would take 250 hours the team does not have. He writes the email every estimator knows by heart: thank you for the opportunity, we must respectfully decline.
No line item records what that email cost. The job was winnable. The margin was real. A competitor with one more free desk that week will build it.
Multiply that Thursday across the country. In our survey of 312 US industrial estimators, 63% of teams reported losing work they were qualified to win in the past year, for lack of estimating hours. This report uses federal data to explain why that number exists and why it will get worse on its current path. It also identifies what separates the firms that avoid it.
I have spent the past year in bid rooms across the Gulf Coast, and the shortage never shows up as a headline. It shows up as silence: a chief estimator who used to bid forty jobs a quarter now bids twenty-six and calls it discipline. Capacity is giving out. This report is the first time I have seen that silence quantified in federal data. It confirms what every estimator already knows and gives it a number the rest of the business can act on.
The numbers that matter
Derivations for calculated figures are stated in full in the Methodology section. Survey figures from The State of Industrial Estimation 2026, n=312 US industrial estimators.
Every estimating desk stands behind $10 million a year
Divide the country's construction output by the people who price it and the exposure becomes visible. The leverage sitting on one estimating seat is larger than most contractors have ever put a number to.
Census puts US construction at a $2.21 trillion annual rate. BLS counts 221,400 cost estimators. Every estimator in America therefore stands behind roughly $10 million of built work per year.
The true number crossing each desk is higher. Work is bid before it is built, typically by three or four competitors, and every losing bid consumes the same estimating hours as the winner. At three bidders per job, the profession prices on the order of $30 million in bid decisions per estimator per year. A 5% miss on a single $20 million mechanical package is a million dollars, more than most mid-market contractors clear on the entire job.
That is the leverage of the estimating desk. It is why the profession’s headcount belongs on the balance sheet, and the exposure scales with the size of the job. On a $150 million industrial EPC package, the same 5% miss is $7.5 million, larger than the entire margin most contractors expect to clear across their whole backlog that quarter.
Why this matters more in industrial than in general building
A tract-housing estimate reuses the same plan dozens of times; the marginal hour per unit is small and the tolerance for a miss is wide, because the next unit corrects it. An industrial piping and mechanical estimate is bespoke every time: unique line lists, unique metallurgy, unique labor productivity assumptions for a specific site and a specific crew. There is no next unit to average the error away. Our survey found the mechanical and piping scope alone consumes an average of 38 estimator-hours on a mid-size industrial package, more than any other trade measured. The $10 million per-estimator figure therefore understates the concentration risk sitting on industrial desks.
Three of every four estimator chairs turn over by 2034
The profession shrinks 4% over a decade in which total US employment grows 3.1%. The decline is not the alarming part. The composition of the openings is.
BLS projects estimator employment falls from 221,400 to 212,100 by 2034, a 4% decline over a decade in which total US employment grows 3.1%.
BLS expects about 16,900 openings a year for cost estimators through 2034, and states the source plainly: all of them come from replacing workers who leave or retire. None come from growth. Run that forward: 169,000 seats to refill in ten years, against a base of 221,400. Three of every four estimator chairs in America turn over by 2034, and even if each one is filled, the profession ends the decade smaller than it began.
The chairs are not interchangeable
A piping estimator who reads a P&ID cold, factors bulks from line data, and prices labor risk on a turnaround took ten years to become that person. The pipeline behind them is thin: the average US construction worker is 42.5 years old, NCCER projects 41% of the workforce retires by 2031, and ABC chief economist Anirban Basu stated in January 2026 that most of 2026’s demand for new workers comes from retirement rather than growth.
Estimating sits at the worst intersection of these trends. It requires the longest apprenticeship of any construction office role and has no dedicated undergraduate pipeline the way civil or mechanical engineering does. Its practitioners skew senior because the job is frequently where experienced field and design people land late in their careers, after a decade or two of learning what things actually cost to build. When they go, the pricing knowledge goes with them, largely uncaptured. In our survey, 64% of teams said their hardest scope depends on one or two people whose method was never written down anywhere a colleague could pick it up. When those people leave, the method leaves.
The apprenticeship math. A typical estimator needs roughly eight to ten years before pricing a complex industrial scope without senior review. A firm that hires today to replace a retiring senior estimator will not have that replacement fully seasoned before 2034 arrives. The clock on replacement runs longer than the runway the data gives the industry.
Bid volume is growing six times faster than the teams pricing it
Against a shrinking profession, the volume of work to be priced keeps climbing. Over five years, bid volume per team rose 24% while estimator headcount rose 4%.
ABC’s model requires the industry to attract 349,000 net new workers in 2026 and 456,000 in 2027 as spending growth resumes. Deloitte’s 2026 outlook expects structures investment to return to growth on the strength of data centers, industrial megaprojects, and reshored manufacturing, the most mechanical- and piping-intensive segments in the market. McKinsey projects global construction demand reaching $22 trillion by 2040, from about $15 trillion of output in 2025, and warns that on current trajectory the industry falls short of demand by up to $40 trillion cumulatively.
Our survey measured what this does at the desk. Over five years, bid volume per team rose 24% while estimator headcount rose 4%. Divide one by the other: the load per estimator grew 19% in five years. Compound that with the retirement schedule above and the scissors close on a predictable date. The cost lands as lost revenue: last year 63% of teams turned away work they were qualified to win because the hours were not there. Part 7 sets out the way through.
| MEASURE | FIVE-YEAR TREND | TEN-YEAR PROJECTION |
|---|---|---|
| Bid volume per team | +24% (survey) | Growing with $2.2T+ market |
| Estimator headcount | +4% (survey) | −4% nationally (BLS) |
| Load per estimator | +19% (calculated) | Compounding |
| Seats requiring re-staffing | — | 76% by 2034 (calculated from BLS) |
| Teams that lost winnable work to capacity | 63% (survey, past 12 months) | — |
The shortage has an address: the Gulf Coast
The national numbers describe an average. The pressure is not evenly distributed, and industrial estimating teams feel it earliest where industrial capex is concentrated.
Census data on manufacturing and industrial construction spending shows the heaviest build-out along the Gulf Coast, driven by LNG, petrochemical, and semiconductor projects, and increasingly around planned data center corridors in Texas and the Southeast. These are exactly the geographies where mechanical and piping estimating talent is scarcest relative to demand, because the specialty draws from a smaller regional labor pool than general building trades.
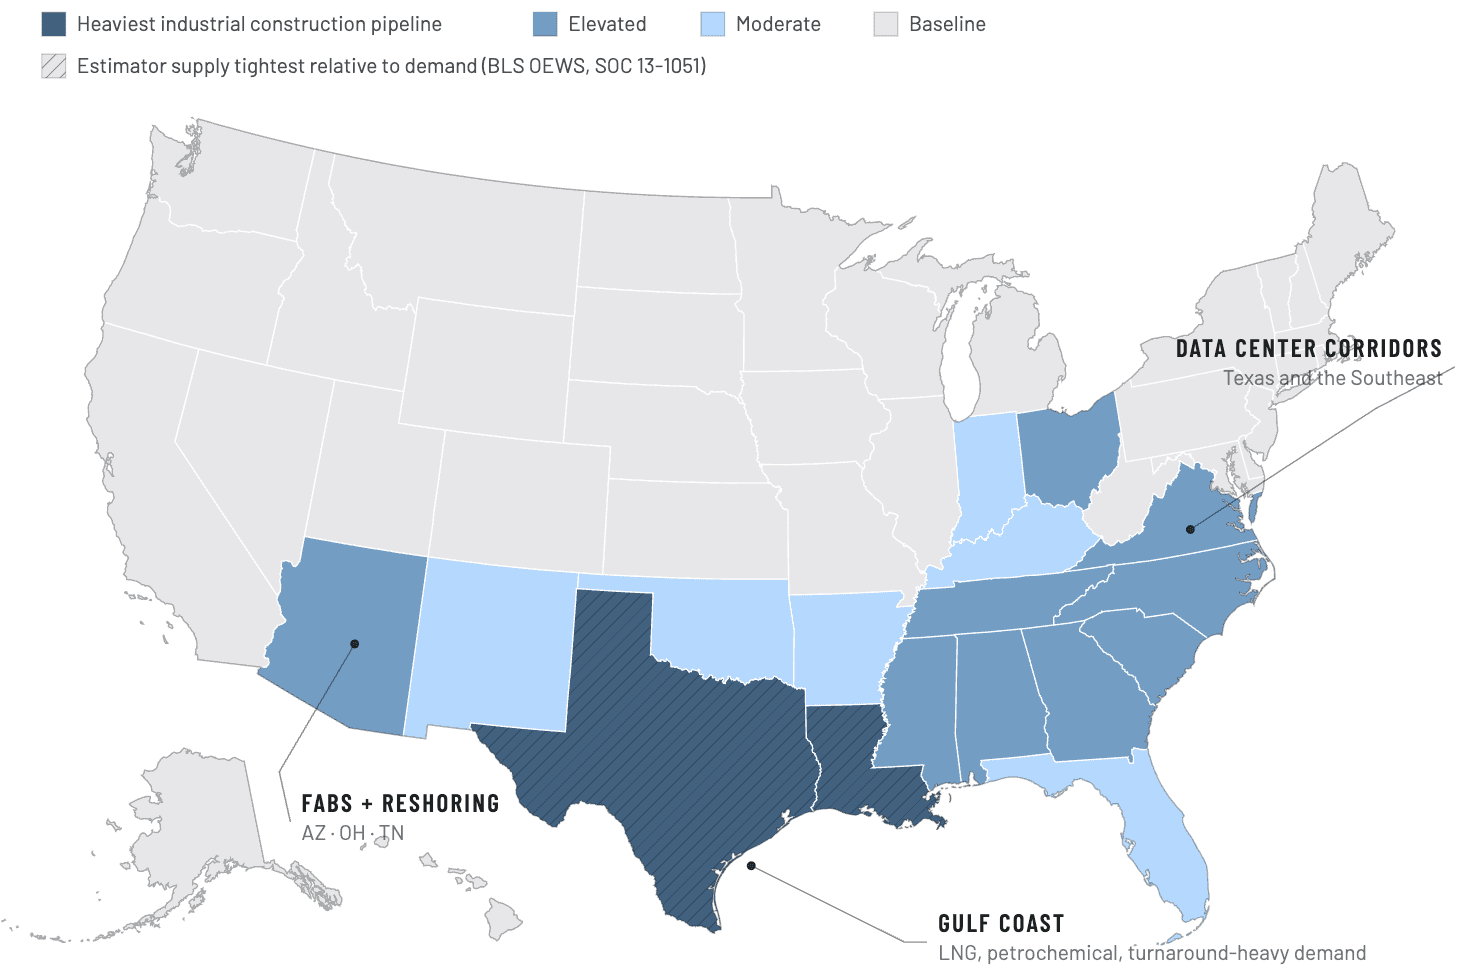
A contractor bidding industrial work in Texas or Louisiana today is not competing only against other bidders for the job. It is competing against every other contractor in the region for the estimators who can bid it, in a labor market ABC already describes as short by hundreds of thousands nationally. Firms without a plan for this regional concentration will find that a hiring push that succeeds elsewhere in the country does not relieve the pressure where the pipeline actually sits.
The most expensive mistake in construction, made with the least tooling
Construction allocates 2.7% of revenue to technology, the lowest of any surveyed industry. Estimating leads every workflow in spreadsheet dependence.
McKinsey’s productivity research frames the half-century problem: construction productivity improved 0.4% annually from 2000 to 2022, against 3.0% in manufacturing. University of Chicago research reaches further back and finds construction the only major US sector whose labor productivity declined outright since 1970. John Fish, chairman and CEO of Suffolk, the $7.5 billion contractor that is New England’s largest, puts it to Forbes as “the only industry in the world where productivity has gone down” in fifty years.
Inside that half-century sits a specific paradox. Deloitte’s technology investment survey found construction allocates 2.7% of revenue to technology, the lowest of any surveyed industry; financial services and manufacturing run 5 to 10%. The 2019 JBKnowledge ConTech Report, the industry’s longest-running technology survey, found 64.9% of contractors saying estimating at their company depends on a significant amount of spreadsheets, the highest of any workflow measured. It was also the only major workflow whose spreadsheet dependence rose year over year while the industry’s overall reliance fell. Our industrial survey, fielded seven years later, found the pattern intact and sharper: 89% pricing in Excel, roughly three-quarters counting quantities by hand.
The exposure math writes itself. The desk that underwrites $10 million a year of built work, in the trade where a takeoff error compounds through material orders, labor plans, and two years of cash flow, runs on the thinnest tooling budget in the American economy. BLS itself attributes part of the projected estimator decline to productivity gains from estimation software. The agency’s projection already assumes the tooling arrives. Firms that stay manual get the other version: our survey found 24% of the estimating week lost to rework and 41% of teams reporting estimates that land more than 10% off actuals.
The firms that broke the pattern all do four things
JBKnowledge's data names the three walls that stop adoption: no staff to support new technology, no budget, and hesitant management. Read in reverse, the list describes the firms that moved.
41.5% of respondents cited a lack of staff to support new technology, 40.7% cited budget, and 33.2% cited hesitant management. Four traits recur across the JBKnowledge, AGC, and Deloitte datasets and the public record of the contractors that led.
They put a name on it
Adoption is owned by a chief estimator, a VDC manager, an operations lead with authority, not by whoever has spare time. Suffolk went furthest: Forbes reports the firm hired full-time AI specialists and spun its internal cost-estimating tool, Ediphi, into a standalone company. A $7.5 billion GC examined its own estimating desk, decided the tooling gap was a business, and built it.
They fund it as a budget line, not a favor
The 2.7% average is an average of many zeros and a few real programs. Fish has put $50 million into more than 50 construction technology startups and told the BuiltWorlds Venture East audience in December 2025 that “our industry is undergoing the most significant transformation in its history.” A mid-market contractor needs no venture fund, only the same accounting: technology as a fixed cost of doing business, sized against the errors it prevents.
The owner of one steel fabrication company gives the target a benchmark every contractor already understands: payroll. His argument is that estimating technology spend has to move from roughly 1% toward 5%, measured against the estimator’s salary it multiplies. The arithmetic makes the case on its own. At the median estimator wage of $77,070, 1% is about $770 a year and 5% is about $3,850, set against a desk that underwrites $10 million of built work annually. Priced that way, the question is no longer whether a firm can afford the tooling. It is how a firm justifies staffing a $10 million desk and then equipping it with less than the cost of the estimator’s parking spot.
Leadership sponsors it from the top
Where the owner or president uses the tool’s output in bid reviews, the cultural question settles overnight. Deloitte’s digital adoption research quantifies the payoff: each additional technology successfully integrated is associated with a 1.14% lift in expected revenue, more than a million dollars a year for a $100 million contractor.
They integrate instead of accumulating
The same Deloitte research found construction businesses running a median of 11 separate data environments, with leaders estimating a unified one would return 10.5 hours a week. The winning pattern is fewer tools that talk to each other, anchored where the money moves: estimating and ERP.
AI’s first assignment in construction: the estimating desk
McKinsey's playbook says to prioritize workflows where performance today depends heavily on a small number of experts. There is no better one-line description of an industrial estimating department.
McKinsey’s Global Institute estimates AI and automation could produce roughly $228 billion of annual value in the US AEC industry by 2030, and that AI could automate 39% of nonphysical work in construction. Its July 2026 AEC report names the first place to start, and it is the estimating desk: the near-term domain McKinsey labels “win and price the work,” covering bid/no-bid analysis, estimating, benchmarking, and pricing scenarios.
The honest version of this problem is that a P&ID is not a document, it is a language, and most AI applied to takeoff so far has not learned to read it, only to look at it. Computer vision can find a symbol on a drawing if you have paid someone to draw a box around ten thousand examples of that symbol first. That is not intelligence. That is memorization with extra steps, and it breaks the moment a client uses a symbol library the model was never shown, or a drafter draws a reducer slightly differently than the training set expected.
What actually reads a P&ID is a discipline, not a lookup table: knowing that a line number encodes size, spec, and service; that a flag on a valve means something different depending on which corner it sits in; that a continuation bubble on sheet 12 has to reconcile with the matching bubble on sheet 31 or the takeoff is wrong before it starts. We have spent months teaching models exactly that discipline, symbol by symbol, convention by convention, the same way you would train a junior estimator, except we have trained hundreds of specialized agents in parallel, each one responsible for a narrow piece of what a human estimator does by instinct: finding lines, resolving continuations, classifying fittings, cross-checking a schedule against the drawing it came from.
None of it is one model doing everything. It is closer to a piping department than a piece of software, and it took that structure to get answers an estimator can actually trust.
The same McKinsey report states the operating principle that makes adoption safe: agents draft, humans own judgment and accountability, and firms need clear records of what the AI did, what data it touched, and who approved the work. Audit trails, in McKinsey’s words, become essential for winning and sustaining client trust.
“Every senior estimator who retires walks out with a pricing method that exists nowhere on paper. The industry has maybe five years to move that knowledge into systems while the people who carry it are still at the desk. And there is one condition the software has to meet before any chief estimator will trust it on a real bid: every number has to be auditable. If you can’t click a quantity and see exactly where it came from on the drawing, you can’t put your license and your margin behind it.”
McKinsey adds a warning the industry should take seriously: automating the work juniors learn on could weaken the training pipeline unless firms train deliberately, through structured review of AI output rather than years of manual counting. That is the correct design constraint. The tool counts; the estimator verifies, prices risk, and decides margin. Counting is the part a 25-year veteran should never have been doing. Judgment is the part no software should do alone.
The arithmetic sets the deadline. Departures run at 16,900 a year. The workforce is 41% retired by 2031. Replacements take years to season, in a labor market short 349,000 people this year alone. A firm can hire against that curve, or it can multiply the estimators it has and capture their methods before the people carrying them leave. Most will need to do both. Neither happens by waiting.
Every contractor we have spoken with about this data reacts the same way in two stages. First relief, because someone finally put a number on a problem they had only ever described anecdotally to their own leadership. Then a harder question: who is actually accountable if the software gets a quantity wrong? That question is the right one, and it is why we built the product around traceability rather than speed. An estimator’s name goes on the bid, not the software’s, and the tool has to earn its place in that workflow the same way a new hire would, by showing its work until it is trusted with less supervision. We are not asking firms to take our word for the numbers. We are asking them to check.
Five moves to make before the retirement wave
Based on the patterns in this data, five actions separate firms that will absorb the coming decade from those that will spend it declining bids.
Of every workflow McKinsey maps across AEC, “win and price the work” is the one where a small number of experts already carry disproportionate risk. It is the highest-leverage place to start.
Adoption succeeds where one person is accountable for it, with authority to change how bids get built, not where it is left to whoever has time between deadlines.
Sizing technology spend as a percentage of the estimator’s salary, not as a rounding error inside a general IT line, makes the cost visible and the payoff obvious.
Any tool that cannot show where a number came from on the drawing does not belong on a bid that carries a license and a margin. This is the one requirement chief estimators consistently name as non-negotiable, and it should be the first question asked of any vendor.
The methods sitting in a senior estimator’s head are only capturable while that estimator is still at the desk. Every quarter a firm waits is a quarter closer to losing the knowledge the software would have needed to learn from in the first place.
What theTakeoff.ai is doing about it
This report exists because we are building the answer.
theTakeoff.ai is an AI takeoff engine built for the heaviest estimating scope in the industry: industrial piping and mechanical, the trade our survey found consumes 38 estimator-hours on a mid-size package, more than any other. It reads P&IDs and drawing sets, extracts line, valve, instrument, and equipment quantities, and produces a structured draft takeoff, so the estimator starts from a reviewable draft instead of a blank spreadsheet.
We built it around the condition McKinsey identifies and chief estimators demand: auditability. Every quantity is click-to-verify. Select any number and the system shows the exact location on the drawing it came from and the governing standard behind the derivation, grounded in ASME B31.3 and B16.5. No black boxes, no unexplained totals, nothing an estimator takes on faith. The estimator stays the authority; the software does the counting and shows its work.
That is how the scissors close. The bid volume is coming, the estimators are retiring, and the firms that thrive through 2034 will be the ones whose desks produce more coverage per estimator-hour without surrendering control of the numbers. The teams losing winnable work for lack of estimating hours are exactly who we are building for.
Methodology, calculations, and sources
Survey figures marked “our survey” are from The State of Industrial Estimation 2026 (theTakeoff.ai and RFP Professionals, Q1 2026, n=312 US industrial estimators). Derived figures are our calculations on published data, with methods stated below.
- 1. US Census Bureau, Monthly Construction Spending, May 2026 (released July 1, 2026). Total construction at a $2,210.2 billion seasonally adjusted annual rate.
- 2. US Bureau of Labor Statistics, Occupational Outlook Handbook, Cost Estimators, SOC 13-1051 (modified August 28, 2025). Employment, projections, openings, wages, and the software-productivity attribution.
- 3. US Bureau of Labor Statistics, Monthly Labor Review, 2024–34 employment projections overview (2026).
- 4. Associated Builders and Contractors, 2026 Workforce Shortage Analysis (January 15, 2026), via Construction Dive.
- 5. NCCER retirement projections and workforce age data, via ABC Carolinas.
- 6. Deloitte, Maximizing the Value of Technology Investments; 2026 Engineering and Construction Industry Outlook; State of Digital Adoption in the Construction Industry.
- 7. McKinsey & Company, How AI Is Reshaping the Future of the AEC Industry (July 2026): $228B US value by 2030 (MGI), 39%/50% automation potential, the “win and price the work” domain, expert-dependency playbook, governance and training-pipeline findings. McKinsey, Delivering on Construction Productivity Is No Longer Optional (August 2024): 0.4% vs 3.0% annual productivity, $15T output, $22T demand by 2040, $40T cumulative shortfall.
- 8. JBKnowledge, 2019 Annual Construction Technology Report: 64.9% of contractors reporting estimating depends on a significant amount of spreadsheets (up from 63.2% in 2018); adoption blockers via NRCA’s summary.
- 9. University of Chicago Booth School of Business, US Construction Has a Productivity Problem.
- 10. Forbes, John Fish profile and February 2024 feature; Business Wire, December 1, 2025.
Executive quotes are reproduced in brief from the cited public sources. The Sayan, Tanmay, and Isha notes are original to this report. The tooling-spend benchmark is attributed to the owner of a steel fabrication company, shared in conversation with the authors.
theTakeoff.ai builds AI takeoff software for industrial piping and mechanical contractors. The engine reads P&IDs and drawing sets and produces structured, auditable draft takeoffs with click-to-verify traceability to the source drawing and the governing standard. theTakeoff.ai is a product of ContraVault AI, whose bid-intelligence platform is used by EPC and infrastructure contractors including Kalpataru, Rithwik, and ISGEC. theTakeoff.ai co-publishes The State of Industrial Estimation benchmark with the RFP Professionals community.